The S&P 500's climb to new all-time highs hasn't come without concern.
With the major averages in focus after a bad Tuesday on Wall Street — one where the Dow Jones Industrial Average saw its worst daily performance since Jan. 3 and all 11 sectors in the S&P 500 sold off — some experts have turned their focus to one seemingly troubling chart.
The three-year chart from The Wall Street Journal tracks the number of S&P 500 stocks at 52-week highs, a number that has shrunk significantly since 2018.
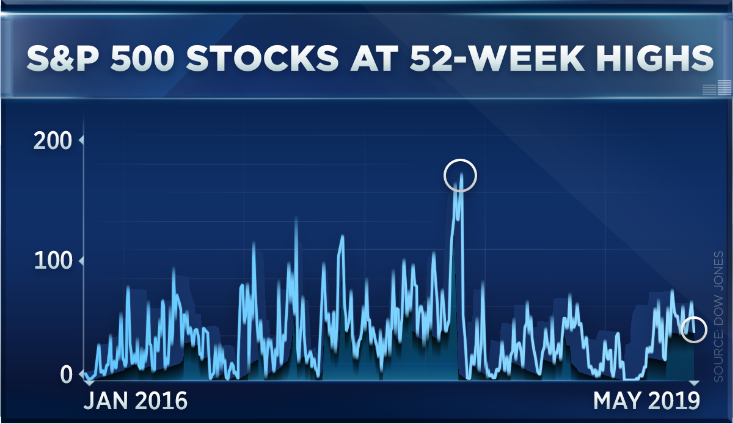
For some, it calls into question the breadth of the recent rally. Many market watchers use breadth as an indicator for whether a rally can be trusted, or whether just a few stocks are driving the index higher.
But, if you ask Mark Tepper, president and CEO of wealth management firm Strategic Wealth Partners, this S&P 500 chart isn't as troubling as investors might think.
"I'm not overly concerned at all," Tepper said Tuesday on CNBC's "Trading Nation." "Actually, if you look at the equal-weight S&P, that's been moving in lockstep and it's actually slightly outperformed the cap-weighted S&P. So the rally hasn't been carried by just the big boys. The participation's actually been across the board. "
Tepper pointed out that while some S&P components might still be well off their 52-week peaks, many other broader trends are "confirming this rally."
"You have discretionary outperforming staples, you have high beta outperforming low beta, small caps are participating," he said. "It's very rare that the market hits all-time highs and then suddenly goes bearish. And, in fact, when the market starts with four consecutive positive months, the rest of the year, on average, it's up 10%. So the odds are tilted in the favor of investors who are long right now."
In Tepper's view, as long as the Federal Reserve remains patient with its monetary policy, interest rates stay low and corporate earnings continue to stabilize, investors can continue to leverage any marketwide pullbacks.
"I'd be using pullbacks opportunistically," Tepper said. "Maybe there's some positions that you wanted to be in a few months ago that you missed out on. Now's your opportunity."
Frank Cappelleri, chief market technician at Instinet, wasn't quite as bullish, but he did point out that it's unusual for the S&P's all-time highs to coincide with positive performance across the index.
"When the S&P makes a new high, it's very rare to see every index, every sector, every group, every stock, do it at the same time," he said in the "Trading Nation" interview.
Looking back at the S&P's action in the last five years, Cappelleri said that even after the index broke above 2,100 in 2016, it wasn't until later that year that the stocks within it actually started to catch up.
"We didn't see that new high list expand until late in 2016, and it really started to … grow in number [in] 2017," he said. "Right now, I think we have to understand that it may take not only a new high in the S&P, but we have to do it for a number of months in a continuation for that to actually happen."
via IFTTT
No comments:
Post a Comment