Uber debuted below IPO price of $45 on Friday morning, and while the overall state of the stock market bears some of the blame, it's also clear from Uber's S-1 filing that the company's core business is slowing down.
CEO Dara Khosrowshahi has made the case that Uber is a complicated business consisting of many potential future growth areas, including food delivery (Uber Eats), trucking (Uber Freight), mobility beyond ride-sharing (Jump Bikes) and, someday, self-driving cars and even flying cars.
But today, as the company goes public, its main business is the business we all know it for: Using your phone to order up a car to give you a ride. Ridesharing made up 81% of its revenue in the last quarter, with Uber Eats making up most of the remainder (18%).
Combined, these businesses are showing user growth, but declining profitability. This points to a fundamental challenge with Uber's business model: The company has to keep prices low enough to draw riders, while paying drivers enough to keep them working for the company. It has not figured out how to do this profitability, and in fact has lost billions in recent years as it's expanded. Managing this two-sided market is particularly hard because Uber faces domestic competition from Lyft, which has suffered similarly large losses.
Take a look at the following charts, highlighted by Business Insider CEO Henry Blodget on Twitter, from Uber's S-1.
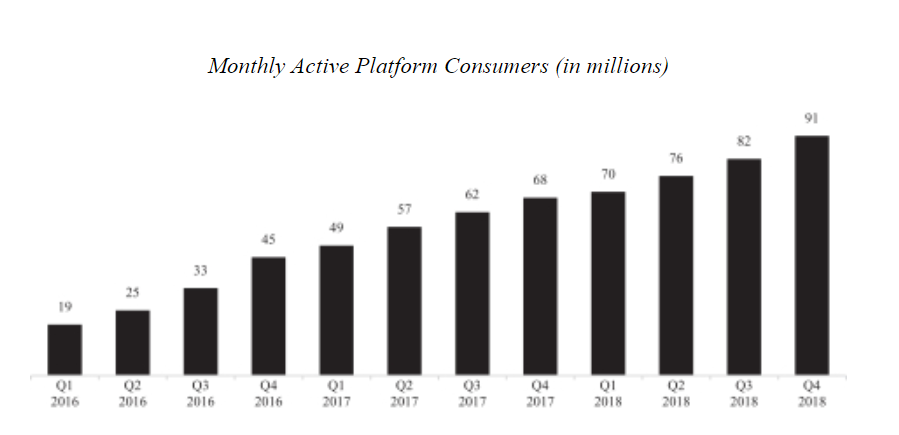
First, monthly active platform users. This looks pretty good — up and to the right, with steady growth:
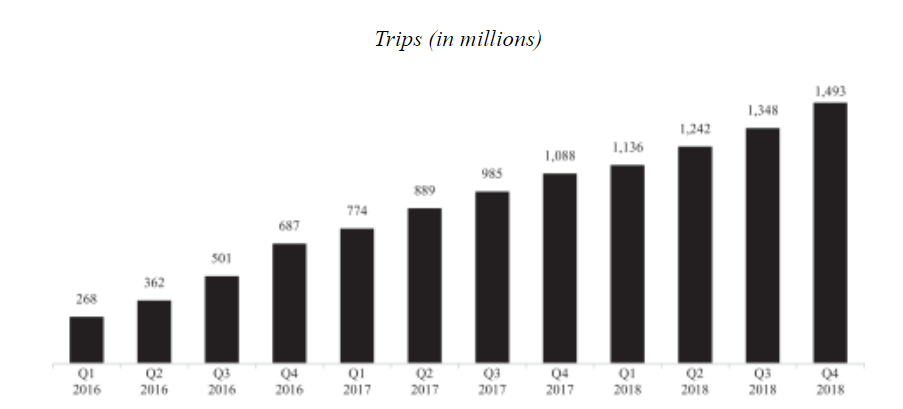
Overall trips — defined as car rides, Uber Eats deliveries, and bike trips via Jump — is also up and to the right:
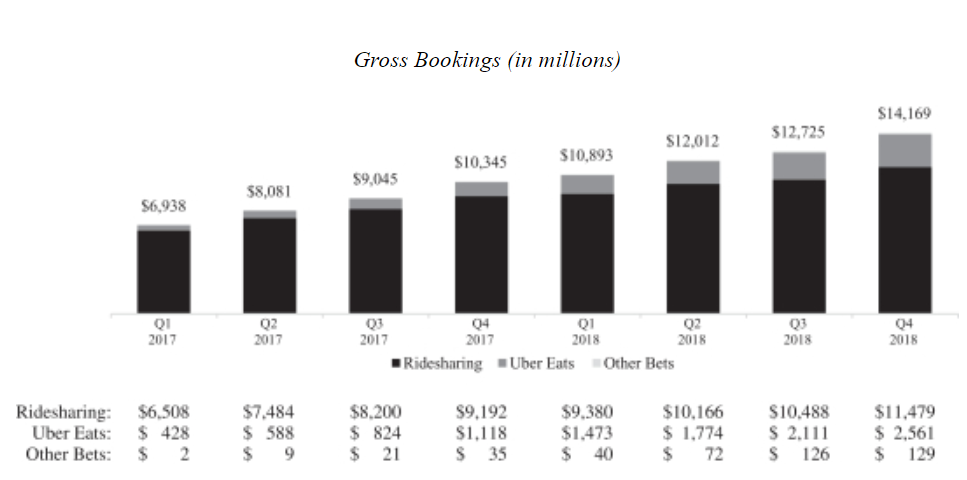
Gross bookings — the amount of money Uber charges customers, in total is also growing:
The trouble begins with the next chart. This is adjusted net revenue, which is the actual amount money Uber takes home from customers after paying out driver incentives and (with Uber Eats) restaurants.
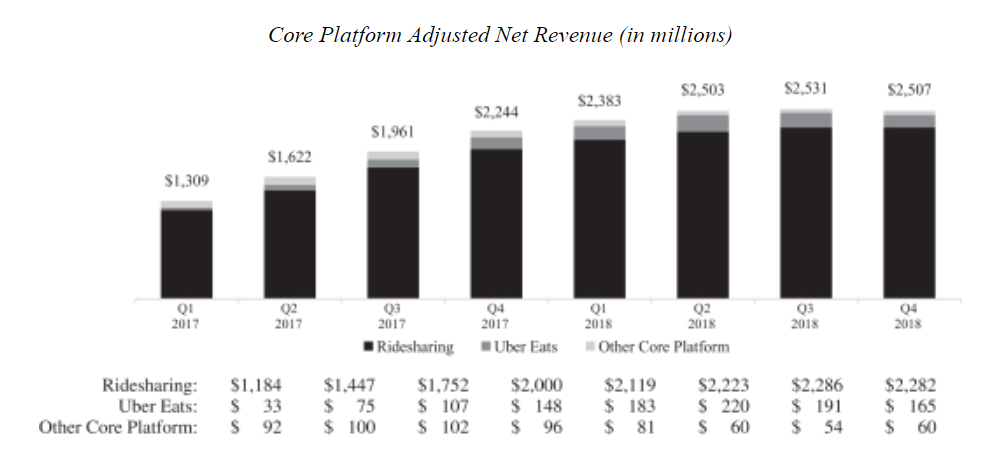
The company writes, "Core Platform Adjusted Net Revenue has historically grown faster than Core Platform Gross Bookings." But the last chart shows exactly the opposite —adjusted revenue has been shrinking, even as gross bookings has continued to grow.
Uber blames a couple of factors. First, Uber Eats is growing faster than core ride-sharing, and there Uber has to pay two parties — the driver and the restaurant — instead of just one. That means growth, compared against total bookings, will be slower.
But more to the point: Uber faces brutal competition from Lyft in the U.S. and other companies abroad, and this is directly affecting its take rate, which it defines as gross bookings divided by adjusted net revenue.
As the company writes:
"Competitive pressure on our Ridesharing Take Rate has caused it to decline in recent periods. Our Uber Eats Take Rate has declined in recent periods as we have onboarded large-volume restaurants at a lower service fee and in geographies with greater competition, such as the United States and India. Overall, we expect our Take Rate to decrease in the near term." [Emphasis added.]
This final chart is particularly damning. It shows the amount of profit Uber makes from its Core Platform business, divided by revenue. In the fourth quarter of 2018, that number turned negative:
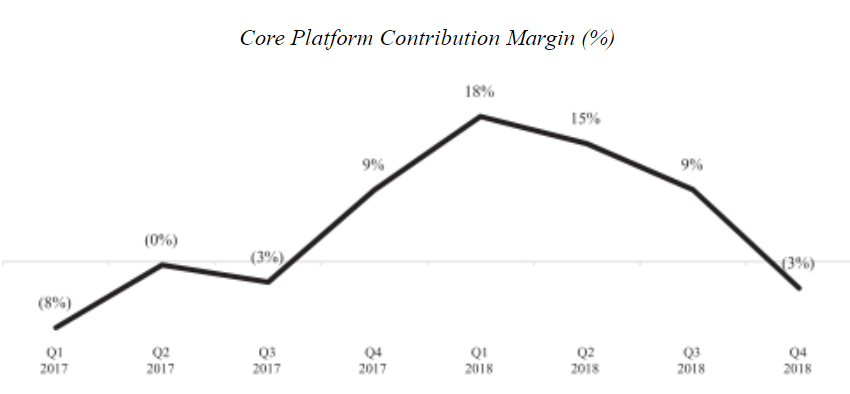
Together, this shows a company that is becoming less profitable as it gets more customers and books more total revenue.
To be bullish on Uber, you have to believe that the company will figure out how to reverse this trend, either through expansion into new markets, eliminating the competition or some other unforeseeable tactic.
On Uber's debut day, there don't seem to be many retail investors who are buying this dream.
via IFTTT
No comments:
Post a Comment